
Images can be used for all types of online surveys, including satisfaction surveys, product or concept tests and reputation or social barometers. This type of questionnaire offers numerous opportunities and advantages for collecting data. From the respondent’s point of view, images also add dynamism and make the questionnaire interactive and fun. An attractive questionnaire with a pleasant approach increases the response rate and gives a more positive image of the survey sender.
Online questionnaires make using images easy and natural. To include images in a questionnaire, the AreYouNet.com online platform proposes the “sensitive zone” closed question with two types of possible answer that allow you to combine the qualitative and quantitative approaches.
In both cases, the image replaces the way a closed question is answered by proposing one or more possibilities.

This type of guided response is closer to a quantitative approach. The predefined click areas give you objective answers that are immediately processed as statistics.
The choice is made by selecting a specific part of the image shown. You can highlight different elements on the visual and compare results instantaneously.
The respondent must be able to easily identify the clickable zones to avoid misinterpretation.
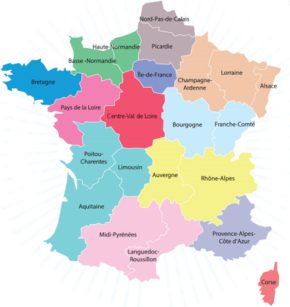
In your opinion, where is a good place to live in France?
If you work at the regional level, opt for a simplified presentation of France with clear regional divisions. Place clickable squares on the name of each region.
Results will be analyzed by comparing the number of clicks on each predefined zone corresponding to a region.
For a more qualitative approach, choose unguided collection. Making the image fully clickable lets you collect a large amount of spontaneous information.
Let respondents click wherever they want on the visual, and then analyze the data by grouping it and establishing which are the zones most and least frequently clicked on.
To make things easier for respondents, allow them to zoom in on the image
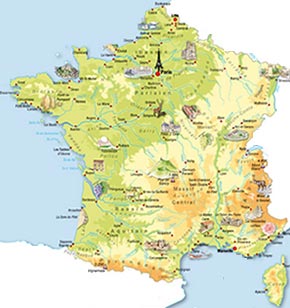
In your opinion, where is a good place to live in France?
Show the geographical map of France without suggesting a clear territorial division.
When you process the results, you will define the zones according to the number of clicks. You can observe regional or departmental divisions or make a more in-depth analysis by isolating favorite cities and urban areas.
When you use an image with predefined sensitive zones in your questionnaire, statistical processing of results is instantaneous. The number and percentage of clicks by zone are sent automatically to the results module of the online survey platform. They can be found:
When you choose a closed question with sensitive zones and a fully clickable image, the results module suggests specific processing in the form of an image.
This interface shows where points have accumulated on the visual and lets you delimit as many zones as you wish. You can then compare the number and percentage of points for each of these zones.
If you want to implement online surveys and need more information about our solutions, contact us using this form or call us at +33 1 57 42 42 42.
JOIN THE THOUSANDS OF AREYOUNET USERS AND MAKE YOUR STUDIES INDEPENDENTLY.
Discover the solution to make the right decisions
AreYouNet is a SaaS platform that offers you Online Survey and Reporting Online Solutions since 2011. We accompany research institutes, agencies and companies on a daily basis in their online information gathering and reporting projects: marketing studies, website studies and satisfaction studies. AreYouNet is a brand of Odity Group.
Be the first to know :
news, guides & advice, case studies,...
Our customer advisers accompany you:

Hello
Let's talk directly


